Post-Season Report
INTRODUCTION
A request was sent to the contributors of the 2010 SEARCH Sea Ice Outlook to summarize the 2010 arctic sea ice season. We asked:
- What were the main factors driving the 2010 summer sea ice?
- What additional data would be useful for improving future Outlooks?
- What are the implications for future arctic sea ice?
We appreciate the contribution by all participants and reviewers who made the 2010 Outlook effort a continued success. The Sea Ice Outlook provides a forum for researchers to evaluate their understanding of the state of arctic sea ice and for the community to jointly assess a range of factors that contribute to arctic summer sea ice minima. The Sea Ice Outlook is not a formal consensus forecast or prediction for arctic sea ice extent, nor is it intended as a replacement for existing efforts or centers with operational responsibility. Additional background material about the Outlook effort can be found on the background page.
SUMMARY
The sea ice monthly extent for September 2010 was 4.9 million square kilometers, based on National Snow and Ice Data Center (NSIDC) estimates. This was the third lowest behind 2008 (4.7 million square kilometers) and 2007 (4.3 square kilometers). It should be noted that the NSIDC value is a monthly averaged estimate and it is dependent on a particular passive microwave algorithm for sea ice. Other satellites, composites, or passive microwave analyses will have slightly different numbers. A review of the differences amongst algorithms and sensors is discussed in a brief report by the Climate and Cryosphere Project's (CliC, http://www.climate-cryosphere.org) Arctic Sea Ice Working Group (also available in the "additional information" section at the bottom of this page). The point here is not which is the "correct" value, but to acknowledge that there will be understandable differences between estimates. We take the NSIDC value as the "operational definition."
It is also important to note that although recent sea ice values have not reached the extreme minimum of 2007, the sea ice minimum has remained well below the long-term "norm" (Figure 1). This may imply that in the present warmer climate conditions, September ice extents below 5 million square kilometers will become the norm.

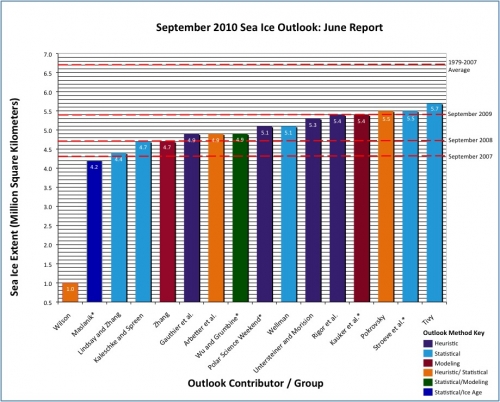
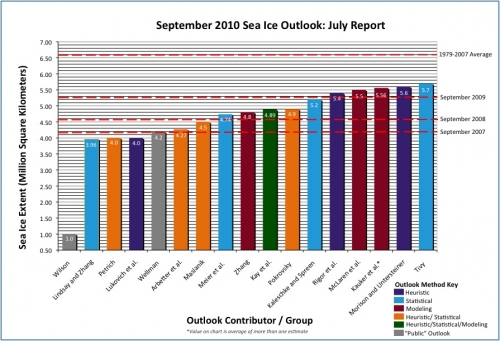
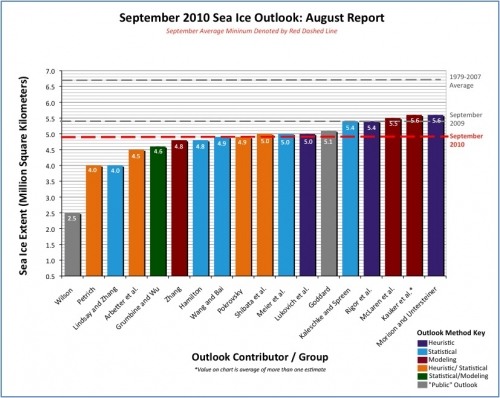
Outlook estimates for September 2010 based on May data had a mean value of 5.0 million square kilometers compared to the observed minimum of 4.9 million square kilometers (Figure 2a). Quartile values were 4.7 and 5.4 million square kilometers. Outlook estimates based on June data had a mean value of 4.8 million square kilometers and Quartile values were 4.2 and 5.4 million square kilometers (Figure 2b). The August report (based on July data, Figure 2c) gave a mean of 4.9 million square kilometers, with Quartile values of 4.6 and 5.4 million square kilometers. The drop in estimate values between the two first Outlooks reflected in part record ice loss rates observed in June. However, ice loss slowed substantially in July and Outlook projections based on July data increased to 4.9 million square kilometers. This illustrates the importance of the summer circulation pattern on the ice cover, and provides a limitation on accuracy of estimates made earlier in the season.


SUMMER SEA ICE AND METEOROLOGICAL CONDITIONS
Figure 3 is a sea ice analysis combined with shipboard observations for the end of summer 2010 provided by Jenny Hutchings. Figure 4 is a sea ice age plot for the end of September provide by Jim Maslanik. While the 2010 melt season started with more multi-year ice (MYI) in the Beaufort and Chukchi seas than seen in recent years and an overall greater percentage of MYI arctic-wide, by the end of August nearly all of this MYI had melted out or ice concentration had fallen below 40%. In the Chukchi Sea, none of the ice greater than two years of age remained, and 97% of the second-year ice was gone. In the East Siberian Sea, there was a 65% reduction in the amount of second-year ice between the end of April and the end of August. A remarkable feature that was captured by satellite imagery was a corridor of low ice concentrations that allowed the Chinese vessel Xuelong, an icebreaker with a low ice class, to reach above 88˚N of latitude. Howell and colleagues recorded open water conditions in the Northwest Passage.


Several contributors, including Walt Meier and Hiroki Shibata, note that there was considerable sea ice present at the end of the spring season. NSIDC reported that the 2010 seasonal sea ice maximum was quite late (31 March compared to the climatological date of 26 February) and the total maximum ice extent approached the climatological mean. This increase was dominated by higher than normal ice extent in the Bering Sea, while ice extent remained below normal elsewhere. The increase in the Bering Sea was perhaps related to the strong negative Arctic Oscillation (AO)/North Atlantic Oscillation (NAO) pattern of winter 2009-2010. It was strongly negative in December and February; the February value was the third lowest NAO in160 years, and strong winds in the Bering Sea led to new ice formation. Community-based observations and field data for the Bering Sea ice cover summarized in the Sea Ice for Walrus Outlook (SIWO) indicate that even though Bering Sea ice was extensive, it was thinner than in past decades and hence susceptible to rapid retreat. Thus, after the winter maximum, pan-arctic ice extent quickly declined, with record daily average ice loss rates for the Arctic as a whole in May and June, and a new record low ice extent for June. This rapid rate of decline likely reflects a combination of thin ice and an atmospheric circulation pattern favoring ice loss. Julienne Stroeve (personal communication) noted that the total loss of sea ice area for 2010 was actually greater than the loss in 2007, based on a greater starting amount in 2010.
An important meteorological pattern is that the summers of the last four years have been dominated by the Arctic Dipole Anomoly (DA) atmospheric climate pattern. This pattern results in high sea level pressure on one side of the Arctic Basin (in this case North America) and low sea level pressure on the other. Because winds tend to blow parallel to lines of constant pressure, this provides sea ice advection generally poleward from the Bering Strait region. These winds also pick up heat and moisture from open water areas in the southern arctic (Chukchi region), transport it northward, and release the heat there. The normal sea level pressure climatology for the summer Arctic has been a flat field or a weak monthly mean low pressure center over the Arctic. In 2007 the DA was present all summer and contributed to record low sea ice conditions. In 2009 the DA was strong in June and July, suggesting a near record sea ice loss for that year, but by August the DA pressure pattern was replaced by the more normal low pressure center. In 2010 the summer started with a strong DA pattern in June, contributing to rapid sea ice loss (see Figure 1). However, the DA was replaced by a low pressure pattern in July (Figure 5), slowing down the rate of summer sea ice loss. But a major surprise for 2010 was that the DA pattern returned in August (Figure 6). We also saw continued above-normal ocean temperatures in ice-free regions at the end of summer (Figure 7).


CONCLUSIONS AND LESSONS
The mean estimates for the 2010 September Sea Ice Outlook based on May, June, and July data were close to the observed value with a rather small quartile distribution (as a measure of deviation from the mean). Most investigators, using a variety of methods, settled on a value slightly below 5.0 million square kilometers. This may represent an interim (or potentially longer-term) state for an Arctic that is now dominated by first-year sea ice.
Thickness surveys and drifting buoys that are part of the Arctic Observing Network (AON) suggest that much of the growth of first-year sea ice in the Pacific sector approaches an end-of-season thickness of around 1.7 m, independent of the starting time of freeze-up in the fall (H. Eicken, personal communication). As one goes further north toward the North Pole, the length of the shortwave radiation season is shortened with less ability to melt out multi-year sea ice (D. Perovich, personal communication). Could the last four years be a plateau state? What would it take to have another major sea ice loss down to a level of 3.5-4.0 million square kilometers? In regards to the first question, J. Stroeve (personal communication) notes that in the present warmer climate state, the tendency for a negative AO winter pattern to promote increased transport of ice into the western Beaufort/Chukchi seas—a pattern that historically has helped to reduce summer ice loss—actually enhances summer ice loss.
Another wild card is the presence of the Arctic Dipole pressure pattern in summer. It seems like it is a necessary feature to maintain current summer sea ice conditions. Yet the reason for its continued year-to-year presence in unknown. Is a return to more climatological flat summer sea level pressure patterns more probable than a continuation of the DA pattern?
Additional Information and Contributions
| Attachment | Size |
|---|---|
| Arbetter et al.431.45 KB | 431.45 KB |
| CliC Sea Ice Reliability Report64.93 KB | 64.93 KB |
| Howell and Agnew571.66 KB | 571.66 KB |
| Lindsay and Zhang253.08 KB | 253.08 KB |
| McLaren29.93 KB | 29.93 KB |
| Meier et al. (NSIDC)457.3 KB | 457.3 KB |
| Pokrovsky29.05 KB | 29.05 KB |
| Public Outlook - Wilson23.81 KB | 23.81 KB |
| Shibata et al.22.19 KB | 22.19 KB |
| Zhang494.13 KB | 494.13 KB |


