POST-SEASON REPORT
HIGHLIGHTS & TAKE-HOME POINTS
Twenty-six groups contributed to the 2011 Sea Ice Outlook.
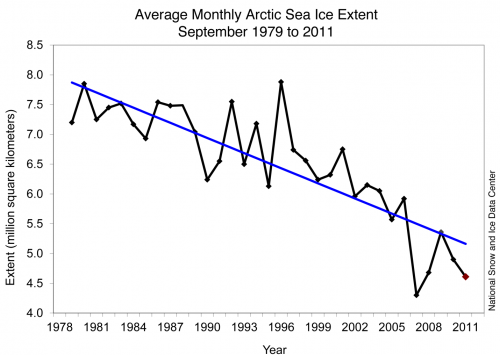
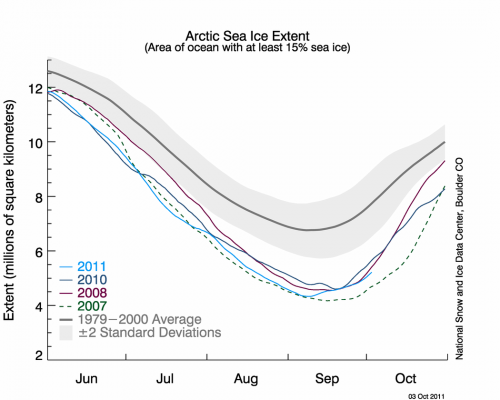
The sea ice monthly extent for September 2011 was 4.6 million square kilometers, based on National Snow and Ice Data Center (NSIDC) estimates. This was the second lowest extent behind 2007 and 2.4 million square kilometers below the 1979 to 2000 average.
It is important to note that the sea ice minimum has remained well below the long-term average every year since 2007. This could imply that in the present warmer climate conditions, September ice extents below 5 million square kilometers have become the new norm.
Contributor Outlook estimates did extremely well this year. Outlooks based on May data had a mean value of 4.7 million square kilometers; Outlooks based on June data had a mean value of 4.6 million square kilometers. In addition, the ranges between quartile values this year were smaller than the 2010 Outlook.
The good performance of the outlooks is in part due to year-to-year persistence of ice conditions—anomalous ice conditions in a given region in one year appear to recur in the following year, which contributes to more accurate sea ice predictions.
The 2011 minimum depended more on initial conditions at the end of spring than extreme weather conditions (like we had in 2007), both in extent and thickness.
INTRODUCTION
We appreciate the contribution by all participants and reviewers who made the 2011 Outlook effort an ongoing success. The Sea Ice Outlook provides a forum for researchers to contribute their understanding of the state of arctic sea ice and for the community to jointly assess a range of factors that contribute to arctic summer sea ice minima. The Sea Ice Outlook is not a formal consensus forecast or prediction for arctic sea ice extent, nor is it intended as a replacement for existing efforts or centers with operational responsibility. Additional background material about the Outlook effort can be found on the background page.
DISCUSSION AND LESSONS FROM 2011
The sea ice monthly extent for September 2011 was 4.6 million square kilometers, based on National Snow and Ice Data Center (NSIDC) estimates. This was the second lowest extent behind 2007 (at 4.3 million square kilometers) and was 2.4 million square kilometers below the 1979 to 2000 average. It should be noted that the NSIDC value is a monthly averaged estimate and it is dependent on a particular passive microwave algorithm for sea ice. We use the NSIDC value as an "operational definition," but other satellites, composites, or passive microwave analyses will have slightly different numbers. This was particularly true this year as scientists at University of Bremen in Germany declared the 2011 extent as a new minimum record that came in below that of 2007: http://www.iup.uni-bremen.de:8084/amsr/minimum2011-en.pdf. The difference is due to University of Bremen's analysis of data from the newer AMSR-E sensor, which has a higher resolution and shows areas of open water that are classified as ice-covered by the lower-resolution sensor that NSIDC relies on. AMSR-E data only go back to 2003, however, making it harder to compare those data to the long-term record. Read more at http://nsidc.org/icelights/2011/11/02/what%E2%80%99s-in-a-number-arctic….
It is important to note that the sea ice minimum has remained well below the long-term average every year since 2007 (Figure 1). This could imply that in the present warmer climate conditions, September ice extents below 5 million square kilometers will become the norm. This conclusion is consistent with the summer 2011 sea ice season with implications for seasonal sea ice projections.
While 2011 was near the lowest value from 2007, the development of ice conditions over the course of summer this year was substantially different from 2007. In 2007, a highly unusual (about once in 20 years) weather pattern lasting all summer was the major contribution to sea ice loss. Persistent high pressure over the Beaufort Sea and low pressure over the Kara Sea were present, now referred to as the Arctic Dipole (AD) weather pattern. This pattern was associated with strong southerly winds from the Bering Strait across the North Pole, bringing warmer winds and ocean waters northward to melt the ice edge and push the ice northward. Less-than-average cloudiness allowed more sunlight to reach the ice. The arctic summer in 2011 began with a similar, but not identical, Arctic Dipole weather pattern, creating record low values in July (Figure 2). But the unusual weather pattern was not to last. For further discussion of the weather patterns, visit the monthly archives of NSIDC's Sea Ice News at http://nsidc.org/arcticseaicenews/.
A major lesson from 2011 is that while the 2007 sea ice minimum can be considered an extreme event due to the nearly four-month persistence of the Arctic Dipole, for 2010 and 2011 the weather patterns changed from month to month, thus minimizing the influence of extreme atmospheric forcing. September sea ice conditions respond to the integral of the forcing over the four summer months, providing an opportunity for atmospheric conditions to average out. Thus, the 2011 minimum depended more on initial conditions at the end of spring, both in extent and thickness.

(National Snow and Ice Data Center, http:/nsidc.org/arcticseaicenews/index.html)

(National Snow and Ice Data Center, http:/nsidc.org/arcticseaicenews/index.html)
Outlook estimates for September 2011 based on May data had a mean value of 4.7 million square kilometers compared to the observed minimum of 4.6 million square kilometers (Figure 3a). Quartile values were 4.4 and 5.0 million square kilometers. Outlook estimates based on June data had a mean value of 4.6 million square kilometers and Quartile values were 4.2 and 4.7 million square kilometers (Figure 3b). Not only are the median values correct but the range between quartile values is smaller than in the 2010 Outlook.
A second lesson of the 2011 Sea Ice Outlook is that all contributors and those with objective methods appear to have locked on to the conclusion of the earlier paragraph that new September sea ice minima are more related to longer term shifts in thermal forcing and ice melt, and in most years, month-to-month meteorological variability over the summer months tends to cancel out extreme atmospheric forcing. Thus we can now say that there is some skill in the Sea Ice Outlook consensus for 2010 and 2011 based primarily on persistence, which is not overwhelmed by unknown individual summer weather events.
This implies the need for further observational work to categorize the current state of arctic sea ice as a new normal, with a mixture of first year and several-year-old sea ice. In spring 2011 and early winter 2011-2012, a large positive Arctic Oscillation (AO) has returned that can contribute to further Fram Strait sea ice export; this impact is something to consider for summer 2012. Sea ice type and ice age estimates will continue to be important as well as direct observations.


We have received positive feedback that maintaining an experimental Outlook is a useful forum for the community and so plan to continue in 2012. We appreciate the time and contributions from all the participants that make the Outlook worthwhile, and to the SEARCH Program and the NOAA Arctic Program of the Climate Program Office for administrative support and guidance.
A Seasonal Summary is available here: Pan-Arctic Seasonal Summary, Adrienne Tivy
| Attachment | Size |
|---|---|
| Arbetter et al.157.54 KB | 157.54 KB |
| Lindsay29.97 KB | 29.97 KB |
| Meier224.04 KB | 224.04 KB |
| Stroeve et al.103.38 KB | 103.38 KB |
| Tivy321.93 KB | 321.93 KB |


